Details

Powerful Analysis Software
SensoVIEW is the ideal analysis software for a broad range of analysis tasks. It includes a comprehensive suite of tools for preliminary examination and analysis of 3D or 2D measurements, allowing roughness or volume calculations and measuring critical dimensions (angles, distances, diameters) with a set of analysis tools. The analysis can be saved and applied to several measurements.
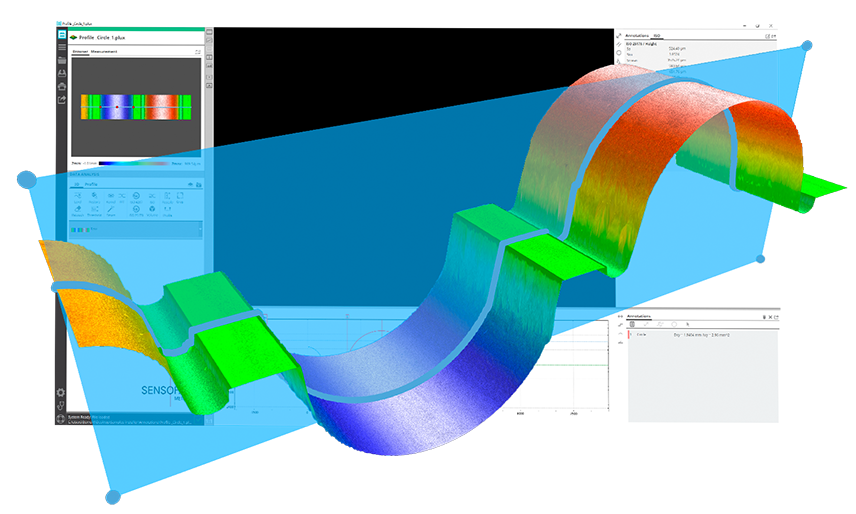
Simple yet powerful, designed for you
This dynamic software provided with the Sensofar systems offers a complete set of user friendly tools for displaying and analyzing measurements. The user is trained and guided through the 3D environment, delivering a unique user experience: Access to operators in just one-click; icons with eye-catching design; a better function understanding; and simultaneous 3D, 2D and profile views are just some of the key features of the SensoVIEW analysis software.

Smart calculations tool for key parameters
SensoVIEW analysis software provides a specific step guide to get surface texture parameters according to ISO 21920 and 25178 for roughness parameters and ISO 12781 for flatness ones. It is the easiest way to fulfill roughness & waviness ISO standards, simplifying the analysis process.
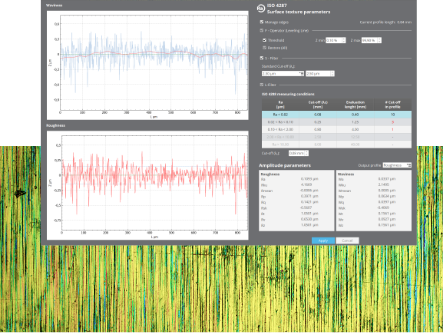
ISO 21920 calculations
It automatically filters the primary profile according to ISO 21920, returning the roughness (Rx) and waviness (Wx) parameters. The calculation of the parameters consists of a set of predefined operators, filters (F-Operator, S- Filter and L- Filter), and additional settings.
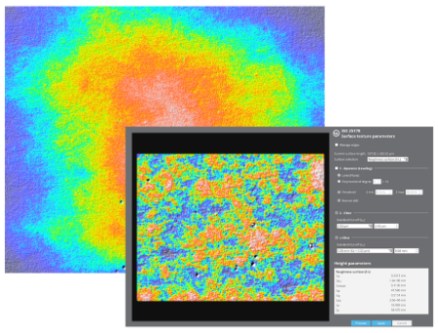
ISO 25178 calculations
Designed for users without a deep knowledge of ISO filters, who can now extract this information by simply selecting the type of surface being analyzed. This operator filters the surface according to ISO 25178, returning the surface texture parameters. The users only have to select its desirable final cut-off.
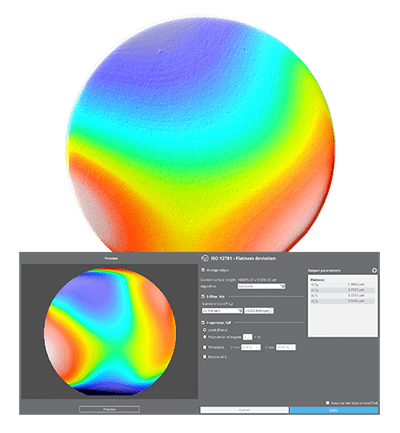
ISO 12781 calculations
SensoVIEW has a dedicated operator to easily extract the four flatness parameters according to ISO 12781: peak to valley (FLTt), peak to reference (FLTp), reference to valley (FLPv), and root mean square (FLTq).
Surface texture characterization
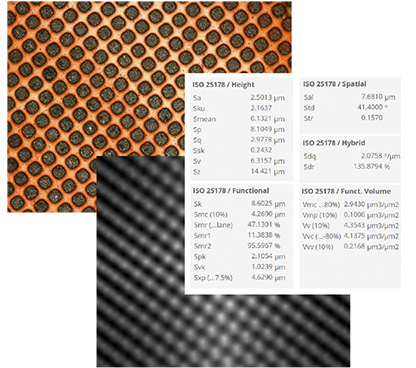
The ISO 25178: Geometric Product Specifications (GPS) – Surface texture: areal standard is an International Organization for Standardization collection of international standards relating to the analysis of 3D areal surface texture. It is the first international standard that takes into account the specification and measurement of 3D surface texture, and in particular defines 3D surface texture parameters and the associated specification operators.
Surface parameters are calculated according to ISO 25178:
Height parameters (height values along the Z axis)
Spatial parameters (spatial periodicity of the data)
Hybrid parameters: (spatial shape of the data)
Functional parameters (parameters calculated from the material ratio curve, surface into motifs, valleys and hills)
Functional volume parameters (volume calculations from the material ratio curve)
The most perceptive visualization of your topographies
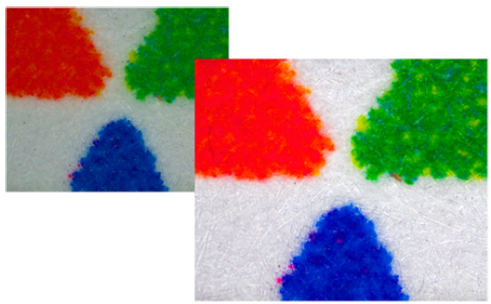
Image control options are always in continuous development for an excellent fit to all sample types and customer needs. A full range of image processing settings are included in each of the rendering visualizations choices and presented together with scale options for a better adjustment.
Auto-managed rendering views
Five smart visualization modes (false color, stack, stack & false color, true color or directional luminance) are always within reach in the main screen.

Automatic flow settings
Users will be free and able to control different parameters like scale range, Z value, stack, color and shadow settings.
Profile tool
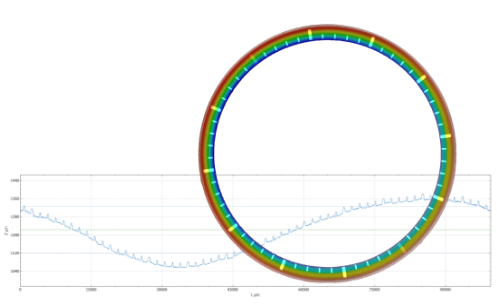
For displaying images and 3D measurements, several profile options are available: horizontal, vertical, circular, top/bottom, free or average profile. The profile data can be analyzed using all the critical dimensions tools.
RESULTS
Customizable reports
SensoVIEW offers flexible reporting options for clear and well-structured documents that display acquisition information, multiple data visualizations, and all performed analyses, including 3D data, 2D profiles, and ISO parameters.


 .
. Create your own Set the content Choose the style Excel & PDF format
headers & footers as you need to display your results to edit as you want
3D exportable in multiple formats
Several options are available for managing the output files. When saving a measurement in SensoVIEW analysis software, the raw data is always preserved. The measurement surface data can be exported in *.dat, *.stl, *.pcl, and *.x3p formats.
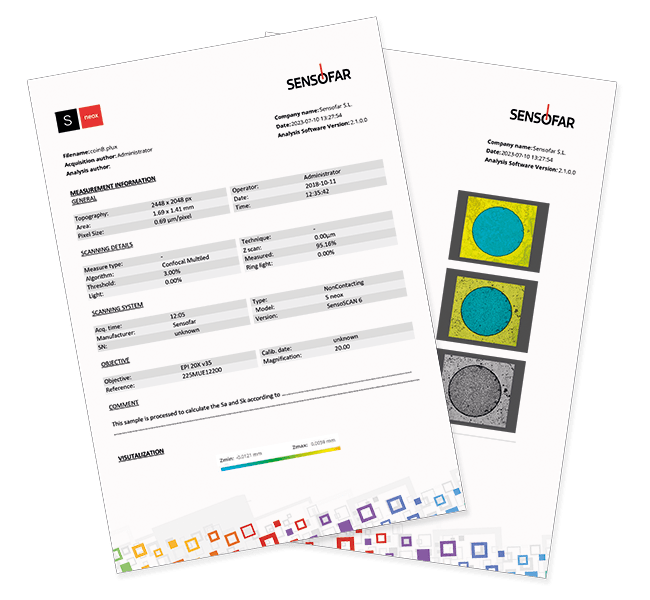
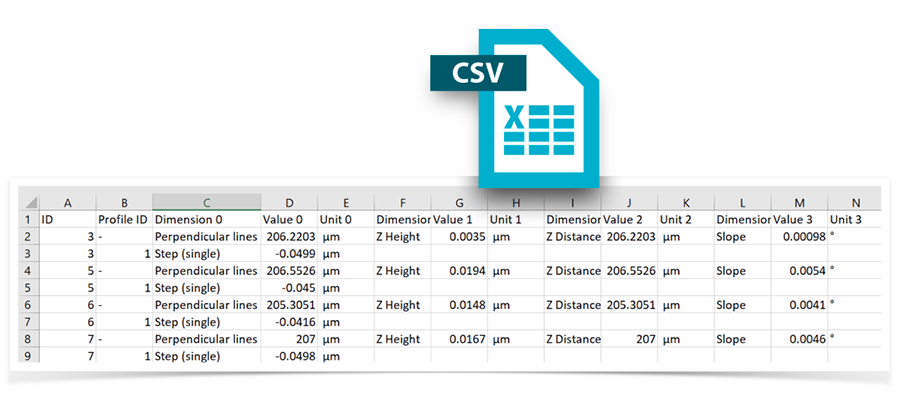
After applying a template, the user can export an Excel file with all the critical dimensions performed, the tolerances used, and statistics.

Guided measurement examination
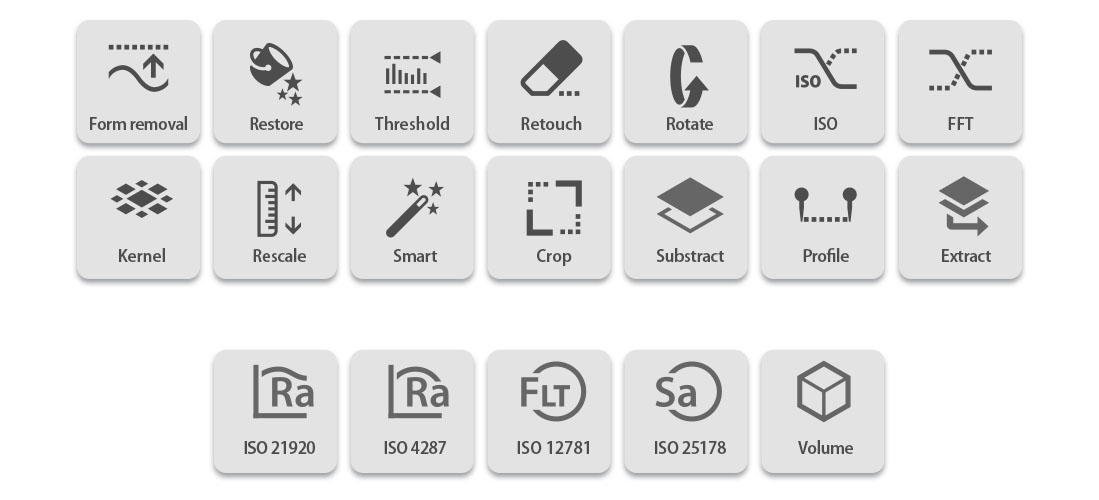
A smart suite of operators, which can be applied to 3D/2D measurements and profiles, provides the opportunity to remove form, apply a threshold, retouch data points, restore non-measurable data and apply a range of filters and/or generate alternative layers by cropping, subtracting or extracting a profile, to prepare your data analysis.
.png)
Form removal
The form removal SensoVIEW’s operator is used for samples that need to be leveled due to a tilt (linear form), an inherent spherical or cylindrical component, or that exhibit or possess an unwanted polynomial term. Several options are available: plane, main slope, cylinder, sphere or polynomial degree. The outcome can be selected between the removed or subtracted result.
Threshold
Useful for filtering the data by adjusting sliders on a histogram.
Z values outside the slider’s limits are set to non-measured
points.
Crop
New areas can be extracted from a raw measurement or from an ‘operated’ measurement to select the region of interest from your sample (several shapes available: square, square fitted to the object, circle or freeform).
Restore
The Restore SensoVIEW’s operator is used to fill (replace) non-measured data points with Z values. This is done either by using adjacent ‘good’ data to interpolate a replacement value, or by simply replacing all non-measured points with a fixed value. The user can choose between restoring the complete area or filling only zones either selecting areas to avoid the restore or filling only zones with less than a certain number of points.
![]()
Rescale
This applies a user-defined vertical factor and vertical offset to the data. It is an ideal operator to create an inverted 3D of your sample, for measuring replicas.
![]()
Doing repetitive tasks, efficiently
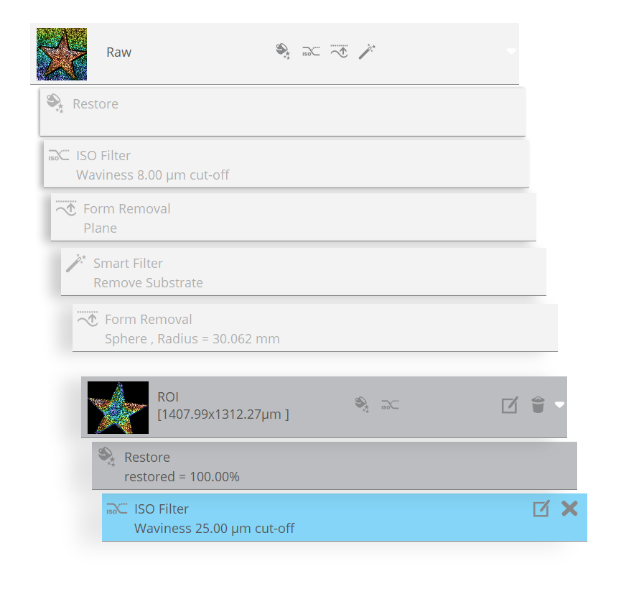
SensoVIEW offers the possibility of adding up filters and calculations in a sequential workflow. At any time, the user can click to any specific step of the workflow and see the result or the settings used on the operator/analysis.

Automate your data analysis with templates
When the analysis process is defined, the user can create a template to apply it to multiple measurements. The template will contain all the information from the filters, operators, and critical dimensions used, as well as the export settings. Besides that, any possible shift or rotation between the template and the topography can be corrected using SensoVIEW’s pattern recognition algorithms.

Measuring critical dimensions in all axes
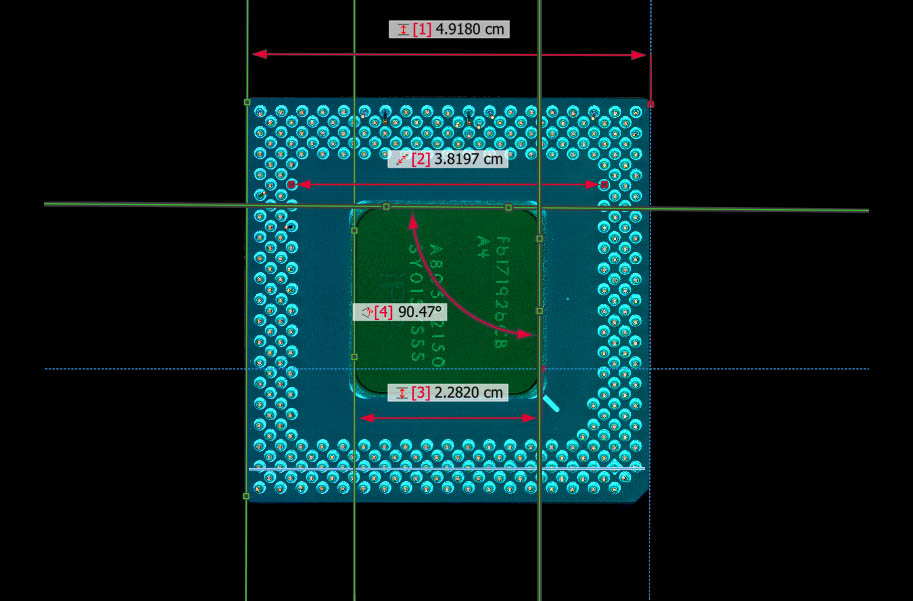
Always with the priority of facilitating operations and procedures for the user, assist tools have been developed for critical dimensions options. Using SensoVIEW, critical dimensions such as angles, distances and diameters can be easily measured on a 3D topography measurement, a 2D profile measurement and a 2D section profile.
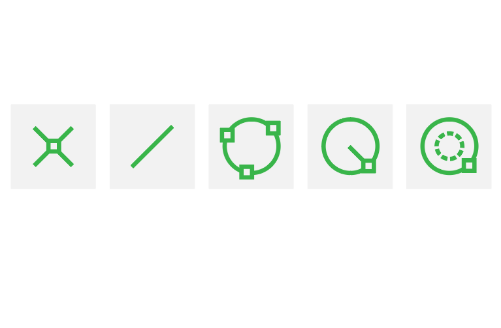
Useful assist
measurement tools
Assist tools are a quick and handy way to draw the most basic and primary forms (points, lines and circles) in selected rendering views to, later on, add the corresponding dimensions. It is an optional aid when drawing the measurement tools.
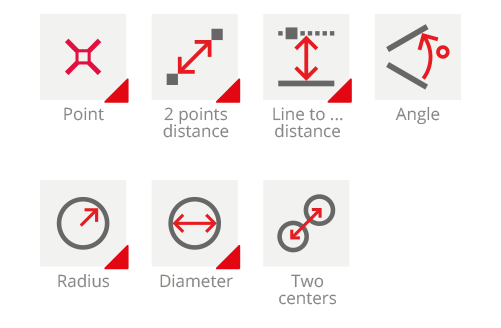
Multiple
measurement tools
A complete set of tools ready to add the most essential dimensions when measuring critical dimensions (radiuses, angles, diameters, step heights and perpendicular & parallel distances). These tools will return a numerical value for a particular dimension.
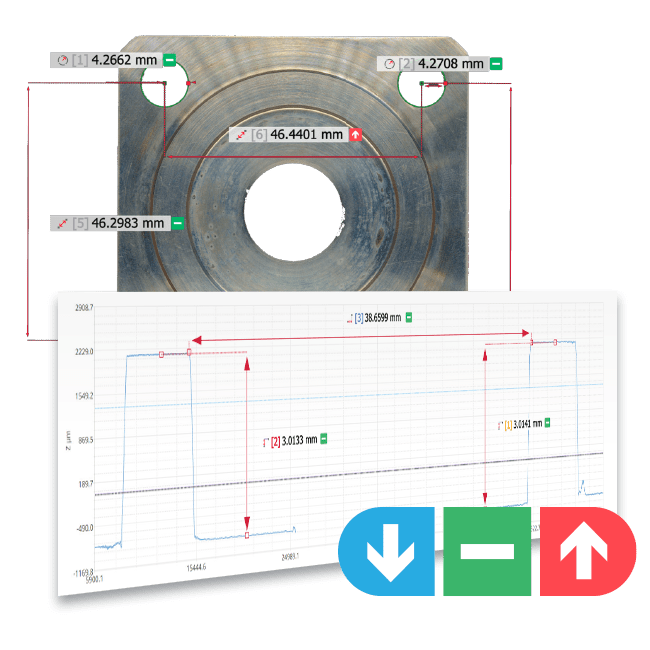
Adding tolerances
Tolerances are available to provide a complete dimensional characterization for both contour and profiles. Users have two flexible options for setting tolerances: defining maximum and minimum values or establishing a reference value with a deviation.
Automatic edge detection
The critical dimensions tools have an auto-adjustment feature. To activate it, the user just needs to right-click and drag over the point, line, or circle drawn in the scene to have it adjusted to the features of the sample. Regarding 2D images, the most suitable data channel can be chosen between Z data, stack, or color information.
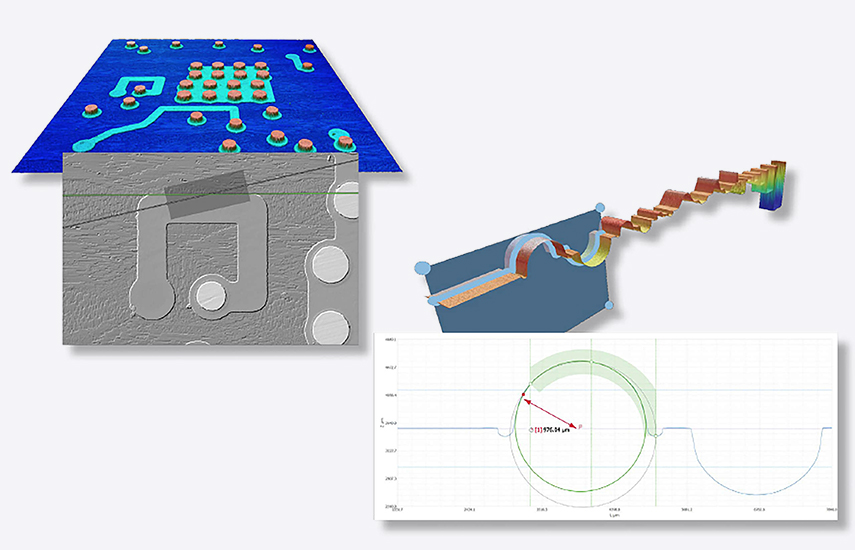
Volume geometries
Our smart volume calculation allows the user to get the volume of a 3D topography. It does a smart segmentation based on thresholds applied in two profiles to obtain volume per each feature and total volume.


This series of video tutorials have been made as a step-by-step guide to understanding each of the functionalities of our software. It is an easy way to share all of the new features achieved in each version release of SensoVIEW and to accompany the user the first time he tries them.
View more about SensoVIEW on main site


